Power BI consulting services
Power BI Consulting Services

Too Many Metrics, Too Little Clarity?
Your business holds valuable data, but without the right tools, turning that data into clear, actionable insights can be challenging. Many businesses struggle with disconnected data, outdated reports, and time-consuming manual processes. Decision-makers end up wasting time searching through spreadsheets, waiting for reports, or missing crucial insights. This leads to delayed decisions, missed opportunities, and inefficient resource use.
At Codewave, our Power BI Consulting Services help you turn Data into value. We assist businesses in implementing and customizing Power BI with predictive analytics and machine learning, as well as upgrading existing solutions to keep them aligned with evolving needs. We begin by understanding your current data setup and business objectives, then customize Power BI and also ensure it is integrated seamlessly with your existing systems—whether CRM, ERP, sales, or finance.
As your business grows, we ensure Power BI adapts to your needs, empowering faster, smarter decisions and helping you stay ahead in today’s data-driven world.

125 hrs
saved per BI user/year
Time-to-market cut
18 → 10 months
6%
faster solution quotations
5%
boost in operational income
Download The Master Guide For Building Delightful, Sticky Apps In 2025.
Build your app like a PRO. Nail everything from that first lightbulb moment to the first million.
Is Your Power BI Really Driving Decisions?
If Power BI is just another reporting tool, it’s time to change that.
We guide you through maximizing the value of Power BI integrated with your existing systems—whether CRM, ERP, or custom software. Our consulting services cover everything from assessing system readiness to guiding your team through a smooth and secure rollout. You’ll gain clarity on what to connect, how to structure it, and which setup best fits your workflows.
We assist you in making informed decisions—choosing between cloud and on-premise setups, mapping data flows, planning refresh schedules, and configuring gateways and user roles. Our goal is to ensure your Power BI foundation is robust before any development begins, preventing rework and minimizing downtime later.
Example: A healthcare provider wants to integrate Power BI with their EHR system. We help them design the setup, automate data refreshes, and build interactive dashboards within Teams. Once live, their teams will have a reliable, scalable BI environment built on a solid foundation and consulting plan.
We design Power BI dashboards for your business needs, using Power BI’s powerful features like DAX (Data Analysis Expressions) and Power Query for data manipulation. Interactive visuals and real-time metrics ensure that you can track performance, spot trends, and make data-driven decisions quickly.
Dashboards are built with role-based access, using Power BI’s security features to ensure each team member only sees relevant data. Automated reports pull live data from your CRM, ERP, and finance systems via secure APIs, removing the need for manual updates and reducing errors. Custom charts, KPIs, and drill-down features powered by Power BI’s advanced visualization tools provide clear, actionable insights, helping your team respond to changes without delay.
For example, a logistics company tracks fleet performance through a live Power BI dashboard. Real-time data on fuel usage, delivery times, and route efficiency, integrated via secure APIs from multiple systems, allows managers to optimize operations and reduce costs.
We integrate Power BI with databases, CRMs, ERPs, and third-party services to create a unified analytics system. This ensures data consistency and holistic, accurate reporting across your organization.
We connect data sources—whether cloud, on-premise, or hybrid—by using Power BI’s native connectors and custom API integrations. These connections ensure a single source of truth, allowing for consistent data across departments. Secure authentication and role-based access control protect data at the user, data, application, and system levels, ensuring only authorized access.
For example, a retail chain integrates sales data from online and offline stores. Unified reporting helps managers track inventory, customer trends, and revenue in one place, improving decision-making across locations.
We automate your Power BI reports to remove manual effort and ensure data stays always updated. Using tools like Power BI Dataflows, Power Automate, and scheduled refresh, we make sure your dashboards reflect real-time business activity—no more last-minute reporting rush.
Reports are built to auto-refresh from live sources like CRMs, ERPs, or databases via secure APIs. We set up role-based access, email subscriptions, and trigger-based workflows, so your team gets the right data at the right time—effortlessly. Automation ensures consistency, cuts delays, and reduces reporting errors.
For example, a financial firm uses Power BI and Power Automate to send monthly dashboards directly to stakeholders. Reports pull real-time data from their finance system, auto-refresh in the background, and arrive via email—keeping teams aligned without any manual work.
Power BI Creation and Implementation
Your Power BI setup should be customized to how your data flows across the Org. We manage the entire setup—from workspace configuration to data model creation—ensuring a seamless, fully functional system with no guesswork.
Using Power BI Desktop, we build robust data models with DAX, create measures, and define calculated columns based on your business logic. Through Power BI Service, we publish and organize reports into workspaces, configure access permissions, and manage refresh cycles. For live connections to on-premise data sources like SQL Server or Oracle, we set up the On-Premises Data Gateway. Each report is designed with defined KPIs, custom visuals, and role-level access to maintain data visibility control.
Example: A manufacturing company implements Power BI to track shift-wise production metrics. Reports pull real-time data from machines and the ERP system, enabling supervisors to monitor output, identify bottlenecks, and adjust operations immediately—ensuring efficiency without delays.
We help you move existing reports, data models, and dashboards from legacy BI tools or Excel-based setups to Power BI—without losing logic, access controls, or report fidelity. This ensures a clean handover and system continuity.
We use Power BI Desktop to rebuild data models and relationships, replicating measures using DAX for calculated columns and KPIs. Power Query handles data transformation tasks—column cleanup, merges, and type changes—before loading into the model. We then re-establish data connections via on-premises gateways or cloud sources and configure Power BI Service to set up refresh schedules, RLS (Row-Level Security), and report distribution.
For example, an insurance company migrates reports from Tableau to Power BI. Existing dashboards are rebuilt with the same business rules, and role-based access ensures teams continue using them without disruption.
We integrate Microsoft Copilot into your Power BI environment so teams can ask data questions using natural language and get immediate answers within the report. This makes self-service analytics easier for non-technical users while reducing dependency on analysts.
We configure Copilot through Microsoft 365 and Azure Active Directory, linking it with your Power BI workspace. Dataset fields are optimized with synonyms, relationships, and metadata tagging to improve Copilot’s response accuracy. Access is managed through security roles, and model performance is validated to support real-time querying without lag or errors.
For example, a retail manager asks, “What’s the weekly revenue by store type?” and gets a chart instantly inside Power BI. This reduces turnaround time and improves decision-making without needing manual dashboard edits.
Your team needs the right skills to make the most of Power BI. We offer hands-on training so they can build reports, analyze data, and automate insights effortlessly. Our ongoing support ensures they stay confident using Power BI every day.
We customize training for different roles—analysts, managers, and executives. Hands-on sessions cover DAX formulas, data visualization, and report automation. Our support includes performance tuning, security updates, and new feature enhancements to keep everything running smoothly.
For example, a healthcare team learns to generate real-time patient reports. With custom Power BI dashboards, doctors and admins track patient trends instantly, improving care and decision-making.
From Data Chaos to Data Confidence
Messy data slows down decision making. Our solutions clean it up, model it right, and turn it into actionable insights.
We help you design optimized data models and write efficient DAX for accurate reporting and better performance. We use DAX Studio to analyze query plans and fix slow measures, while Tabular Editor helps manage calculated columns, KPIs, and hierarchies directly within the model—reducing manual overhead.
For example, a logistics company gets slow reports due to bloated models. We rewrite DAX logic and optimize relationships, reducing load time and improving accuracy—without changing their data source.
Your business teams can explore data and build reports without writing code or waiting on IT. Power BI Desktop allows users to create dashboards using drag-and-drop visuals and built-in data connectors. Power BI Service enables web-based sharing, natural language queries, and on-demand report access across devices.
For example, a store manager at a retail chain reviews daily sales, filters data by product and region, and makes pricing changes—all without needing a data analyst.
Access real-time reports and dashboards from anywhere with Power BI’s mobile solutions. Interactive visualizations adjust to any device, ensuring seamless data analysis on the go. Offline mode lets you view reports without connectivity, while push notifications alert you to critical updates, keeping you informed at all times.
For example, a sales team can track live revenue metrics from their phones while traveling. With instant access to sales trends, forecasts, and inventory updates, they can make quick, data-driven decisions, improving customer interactions and closing deals faster.
Your data stays safe with built-in security and governance controls. Role-based access ensures everyone sees only what they should. End-to-end encryption protects data at rest and in transit, while compliance features like GDPR and HIPAA help you meet regulations without extra effort.
For example, doctors can securely access patient records while strict controls prevent unauthorized sharing. Automated logs track every access, keeping data protected and ensuring compliance with healthcare regulations—all while ensuring the right people get the right information.
Connect Power BI with tools like Salesforce, Google Analytics, and SharePoint without hassle. Your data syncs in real-time, so reports are always up to date. No more manual data transfers—APIs handle it for you. Custom connectors bring all your platforms together, making reporting smoother and faster.
Say you run an e-commerce business. Linking Power BI with Google Analytics lets you see customer behavior alongside sales data. Automated data refresh means your dashboard updates itself, giving you live insights into marketing performance and conversion trends—no extra work needed.
We integrate Power BI dashboards into your applications using Power BI Embedded to provide live reports within customer portals, and Azure AD for secure token-based authentication and SSO access. This gives users analytics without switching platforms or risking unauthorized access.
For example, a fintech startup embeds performance dashboards into its investor portal. Users view live metrics tied to their accounts via token-based access—no extra login needed, and no data leakage across users.
Codewave’s Power BI Consulting Approach
Success with Power BI starts with the right approach. At Codewave, we follow a clear, step-by-step process. Every step enhances data accuracy, reporting speed, and decision-making efficiency.
We start by deeply understanding your organization’s design, operations, and business goals. By meeting with stakeholders, we identify key business success metrics, define reporting needs, and assess how data is currently managed. Using Business Process Mapping (BPM), we uncover critical workflows and data touchpoints. This initial step ensures we’re aligned with your objectives from the start, setting the foundation for addressing business challenges effectively from day one.
Once we know what data is needed, we connect all relevant data sources to Power BI. We integrate data from ERPs, CRMs, and third-party systems, ensuring all critical data is captured. By using Power Query Editor, we clean and transform data before pushing it into Power BI. This lets your dashboards stay current with the most accurate, real-time data possible.
After integration, we focus on building a solid data model. The data structure is essential for performance, so we use the Star Schema method to organize tables and relationships efficiently. By doing this, we ensure that queries are faster, reports load quicker, and decision-making is more efficient. Optimizing the data model helps businesses access insights quickly and make informed decisions on the spot.
With the data model in place, we move to developing the reports. Using DAX (Data Analysis Expressions), we create calculated columns and measures that meet the specific needs of each user. The goal is to make reports highly interactive, with features like drill-through and filtering to allow deeper insights. Custom reports help teams focus on what's important, streamlining decision-making.
Security is a top priority. We set up Role-Level Security (RLS) to restrict access to sensitive data based on user roles. This ensures that only authorized individuals see the data relevant to them. Additionally, we implement Data Loss Prevention (DLP) and ensure compliance with standards like GDPR and HIPAA, so your data stays protected and your company stays compliant.
Finally, once everything is set up, we train your teams to get the most out of Power BI. This includes practical training on creating reports and dashboards. We also set up Power BI Service for ongoing support and monitoring. This allows us to refresh data automatically and address any issues that arise. Continuous support ensures your team can independently manage reports while having a trusted partner for any future needs.
Turn Data to Value: Codewave’s Dynamic Power BI Tools
We use the best tools for Power BI consulting to refine your metrics, organize data, and bring all your data sources together. Our tools make your models work better, visuals clearer, and tasks automated—so you get fast, accurate insights to make smarter decisions.
| Data Integration & ETL |
|
| Data Modeling & Optimization |
|
| Report Development & Design |
|
| Data Security & Governance |
|
| Collaboration & Sharing |
|
| Cloud & Data Storage |
|
| Data Visualization |
|
| Performance Tuning & Optimization |
|
| Version Control & Deployment |
|
| Advanced Analytics & AI |
|
From Finance to Healthcare – Power BI That Delivers
Codewave partners with industries from finance to healthcare, turning data into your competitive edge. No matter your field, we craft Power BI solutions that truly fit.
| Healthcare | Develops interactive dashboards for patient outcomes, resource allocation, and hospital efficiency. Integrates EHR data for real-time insights, predictive analytics, and compliance tracking to improve patient care, reduce operational delays, and support data-driven decision-making in hospitals, clinics, and research institutions. Example: Analyzes ICU bed occupancy trends, predicting shortages and reallocating resources in real time to prevent patient care disruptions. |
| Transportation | Monitors fleet performance, fuel consumption, and delivery times through real-time analytics. Integrates GPS, IoT, and sensor data to optimize routes, reduce delays, track vehicle maintenance, and ensure efficient supply chain operations with predictive analysis for demand fluctuations and asset utilization. Example: Uses historical traffic data and weather conditions to suggest optimal delivery routes, reducing transit delays and fuel costs. |
| Energy | Provides real-time analytics for monitoring power grid efficiency, consumption trends, and asset performance. Predicts equipment failures using sensor data, optimizes energy distribution, and enhances sustainability efforts by identifying inefficiencies and optimizing renewable energy integration with AI-powered forecasting. Example: Detects transformer overheating patterns and alerts operators before failure, preventing outages and reducing maintenance costs. |
| Retail | Tracks sales performance, customer behavior, and inventory in real time. Uses AI-driven demand forecasting to optimize stock levels, prevent overstocking or shortages, and analyze regional sales trends to support data-driven marketing and pricing strategies for maximizing profitability. Example: Analyzes seasonal shopping trends to adjust inventory levels, preventing stockouts of high-demand products during peak sales periods. |
| Insurance | Detects fraud through anomaly detection, automates risk assessments, and evaluates policyholder behavior with AI-driven analytics. Enhances underwriting processes by analyzing historical claim data, predicting risks, and optimizing pricing models to improve profitability and reduce fraudulent claims. Example: Flags suspicious claims by identifying unusual claim frequency or inconsistencies in reported incidents, reducing payout losses. |
| Agriculture | Analyzes crop yields, soil health, and climate patterns using Power BI dashboards. Supports precision farming by integrating satellite and sensor data to optimize irrigation, fertilization, and pest control strategies, increasing productivity while reducing resource wastage. Example: Correlates rainfall data with soil moisture sensors to optimize irrigation schedules, reducing water waste and improving crop health. |
| Education | Tracks student performance, faculty productivity, and institutional efficiency. Uses predictive analytics to identify dropout risks, personalize learning strategies, and improve curriculum planning by analyzing attendance, exam scores, and engagement metrics. Example: Flags at-risk students based on declining grades and absenteeism, allowing early intervention with personalized support programs. |
What to expect
What to expect working with us.
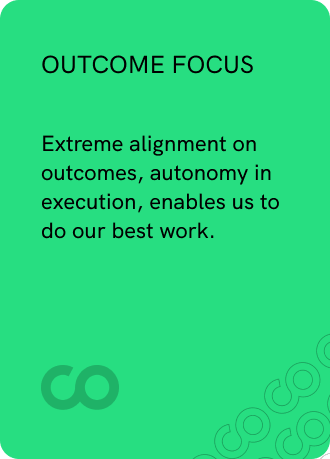
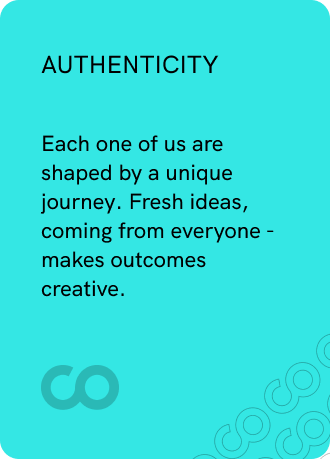

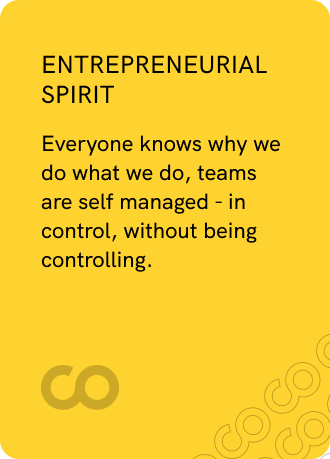
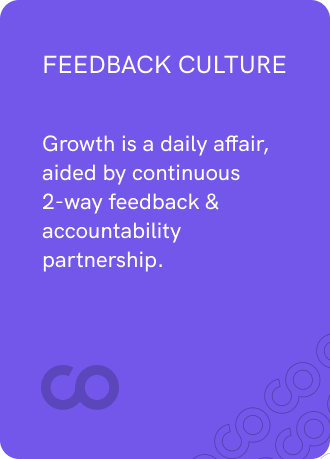
We transform companies!
Codewave is an award-winning company that transforms businesses by generating ideas, building products, and accelerating growth.
Frequently asked questions
Power BI consulting services help businesses analyze data, create interactive reports, and make data-driven decisions. Consultants assist with implementation, dashboard development, data modeling, and performance optimization to improve reporting accuracy and business insights.
Organizations handling large datasets or struggling with reporting inefficiencies benefit from Power BI consulting. It helps finance, healthcare, retail, and manufacturing industries visualize key metrics, optimize operations, and uncover trends with real-time analytics.
They transform raw data into interactive dashboards and reports, allowing teams to identify trends, detect anomalies, and make informed business decisions. With automated data refresh and AI-driven insights, companies react faster to market changes.
Power BI integrates with databases like SQL Server, cloud platforms like Azure and AWS, and third-party apps like Salesforce, Google Analytics, and SAP. It pulls structured and unstructured data into a centralized reporting environment.
A consultant ensures efficient implementation, improves report performance, optimizes data models, and provides best practices for dashboard design. They also help with governance, security, and compliance, ensuring accurate and secure reporting.
Codewave follows a business-first approach, understanding your KPIs before designing dashboards. We optimize data models, automate reports, and ensure reports align with decision-making needs. Our team also handles integrations with cloud, on-premise, and third-party applications.
We work with healthcare, retail, finance, logistics, and manufacturing clients. Our solutions focus on industry-specific reporting needs, such as patient analytics in healthcare, fraud detection in finance, and supply chain optimization in retail.
Yes, we implement row-level security, role-based access, and compliance-driven data governance. Our solutions align with HIPAA, GDPR, and industry regulations, ensuring sensitive data remains protected while enabling secure, role-specific reporting.
We use optimized DAX queries, reduce unnecessary visuals, implement aggregations, and enhance data modeling. Our consultants also fine-tune refresh schedules and use DirectQuery or Import Mode based on reporting needs to ensure high-speed analytics.
Yes, we offer post-implementation support, including troubleshooting, dashboard enhancements, and performance tuning. We also provide training sessions to help teams maximize Power BI’s capabilities and maintain reporting efficiency.
Absolutely. We connect Power BI with ERPs, CRMs, cloud storage, and IoT platforms. Our consultants ensure real-time data sync between Power BI and platforms like Salesforce, SAP, Dynamics 365, and Azure Data Lake.
Our expertise lies in business-driven analytics, custom dashboard development, and scalable Power BI solutions. We focus on meaningful insights, actionable reporting, and performance optimization, ensuring data translates into measurable business growth.


