Introduction
Enterprises today aren't short on data. They're drowning in it. According to Seagate's IDC-backed research, only 32% of available enterprise data is actually put to work—leaving 68% sitting unused across disconnected systems, cloud silos, and legacy platforms.
The pressure this creates is real. AI initiatives stall because models lack verified context. Analysts spend mornings reconciling contradictory numbers from Sales and Finance before a single decision gets made. New data sources require custom integrations that break six months later.
Enterprise knowledge graphs are frequently treated as a technical architecture choice. In practice, they're an operational decision: one that determines whether your data works for your business or simply accumulates in it.
This article covers what an enterprise knowledge graph is, the measurable advantages it delivers across data accessibility, AI reliability, and decision speed — and the real costs organizations absorb when they defer the decision.
Key Takeaways
- Enterprise knowledge graphs connect siloed systems into a unified, relationship-aware data model that machines and analysts can both query.
- Data teams spend 38% of their time on preparation and cleaning—knowledge graphs cut that reconciliation burden significantly.
- Gartner reports that 50% of GenAI projects are abandoned after proof of concept, largely due to poor data quality—a problem knowledge graphs fix at the data layer.
- Industries from healthcare to financial services are using knowledge graphs for fraud detection, clinical data integration, and supply chain risk.
- Start with one bounded use case and 3–5 systems, not the entire enterprise.
What Is an Enterprise Knowledge Graph?
An enterprise knowledge graph is a structured, machine-readable model of your organization's data—one that captures not just the data itself, but the relationships between entities. Each entity becomes a node; each relationship becomes an edge. That includes:
- Customers and their purchase history
- Products linked to support tickets and returns
- Suppliers connected to contracts and transactions
- Contracts tied to renewal timelines and account owners
IBM describes a knowledge graph as "a network of real-world entities that illustrates the relationships between them." The underlying structure, defined by W3C's RDF standard, represents each piece of knowledge as a subject-predicate-object triple—for example: Customer A → filed → Support Ticket #442.
Where It Fits in Your Architecture
A knowledge graph is not a replacement for your data warehouse, BI tools, or operational databases. It's a semantic layer that sits on top of existing systems—connecting and contextualizing data across departments, clouds, and sources without necessarily moving it.
It's the layer that answers cross-domain questions your current stack can't handle: "Which customers who purchased Product X also filed a support ticket this quarter and have a contract renewal in 90 days?" In a relational database, that answer requires a data engineer, three SQL joins, and several days. In a knowledge graph, it's a single traversal.
The Goal Is the Answer, Not the Graph
The graph is infrastructure. The goal is fast, accurate answers to complex business questions—ones that currently require manual data assembly, and ones your AI systems need verified context to handle reliably. Build the graph right, and that context becomes a reusable asset across every downstream application.
Key Advantages of Enterprise Knowledge Graphs
The advantages below reflect operational impact—what actually changes for data teams, business analysts, and decision-makers—not theoretical capability. Each ties to outcomes organizations measure: cost, speed, quality, or risk.
Advantage 1: Breaking Down Data Silos to Unify Organizational Knowledge
Most enterprises don't run one system. According to MuleSoft's 2025 Connectivity Benchmark Report, the average enterprise manages 897 applications, with only 29% integrated. Every unconnected system is a fragment of truth that never meets the fragments sitting next to it.
A knowledge graph reconciles these sources into a single semantic layer. It ingests data from CRMs, ERPs, HRIS platforms, and cloud warehouses, then resolves duplicate or conflicting entity references. "Robert Smith" and "Bob Smith" become a single linked node, unified through an ontology that defines consistent relationships across systems.
What this replaces: brittle, manually maintained point-to-point integrations that break every time a system updates or a new data source is added.
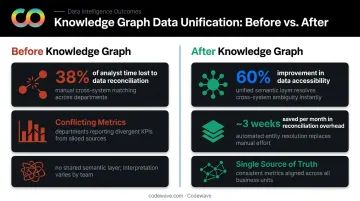
The time cost is measurable. Anaconda's 2023 State of Data Science report found that data preparation and cleaning consume 38% of a data scientist's time. That's reconciliation work: pulling numbers from disconnected systems and forcing them to agree before any insight can happen.
Codewave clients have seen 60% improvement in data accessibility and approximately 3 weeks saved per month in manual data work after structured unification. When "churn" means the same thing in Sales and Finance, meetings shift from debating whose number is correct to actually solving the problem.
KPIs impacted:
- Data accessibility rates
- Time spent on manual integration
- Cross-functional query resolution time
- Analyst productivity
- Number of active data silos
When this matters most: Organizations running 10+ data systems, companies with active M&A activity, and teams with cross-domain reporting needs (supply chain + finance, customer + compliance) see the highest immediate impact.
Advantage 2: Grounding AI in Verifiable, Context-Rich Facts
Most enterprise AI failures trace back to one structural problem: LLMs and semantic search systems don't know what your business means by "customer," "risk," or "compliance." They operate without a verified factual foundation.
That gap produces hallucinations, inconsistent outputs, and answers that can't be trusted in high-stakes decisions.
A knowledge graph solves this by defining entities, their properties, and their relationships through a formal ontology. When an LLM queries the graph, it retrieves facts (not inferences) about how your data connects.
Gartner found that 50% of GenAI projects are abandoned after proof of concept, with poor data quality cited as a primary cause. Gartner also predicts 40% of enterprises will adopt GraphRAG by 2029 to improve LLM accuracy, combining knowledge graphs with retrieval-augmented generation to ground AI outputs in verified business context.
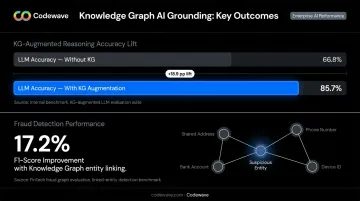
Research published in a 2024 survey on knowledge graphs and LLM hallucination reduction found that KG-augmented reasoning increased ChatGPT accuracy from 66.8% to 85.7% on structured reasoning tasks.
Fraud detection is a concrete example. Knowledge graphs can surface connections across seemingly unrelated entities: shared addresses, phone numbers, or accounts appearing across multiple insurance claims that siloed systems would never flag. A 2021 ACM peer-reviewed study on auto insurance fraud detection reported a 17.2% improvement in F1-score when a knowledge graph approach was applied to gang fraud identification.
Codewave clients working in regulated environments have achieved 90% fewer data errors and 95%+ data accuracy after grounding AI systems in structured, governed knowledge.
KPIs impacted:
- AI output accuracy rates
- Hallucination and error incidents
- Time to detect compliance or fraud anomalies
- Trust scores for AI-assisted decisions
When this matters most: Any regulated industry (healthcare, insurance, financial services) where incorrect AI outputs create legal, financial, or reputational exposure.
Advantage 3: Faster Cross-Domain Decision-Making Without Bottlenecks
In most enterprises, answering a complex business question means submitting a BI ticket, waiting for a data engineer to build the query, and still arriving at a result stakeholders debate. The bottleneck isn't analytical ability. It's data access.
Knowledge graphs change this because the relationships between entities are already encoded. New questions don't require new joins, schema changes, or pipeline builds. Analysts can traverse the graph (linking customers to products, products to contracts, contracts to support history) and surface patterns that were previously invisible without engineering support.
Every delayed answer pushes a decision back. That delay creates workarounds, usually spreadsheets, which introduce version drift and inconsistent metrics that push the next meeting into another reconciliation debate. Organizations that fix this infrastructure stop defending their numbers and start using them.
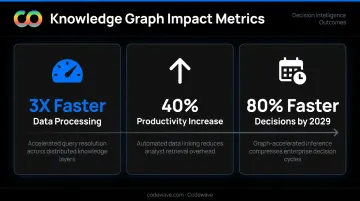
Gartner's decision intelligence research predicts that explicitly modeled business decisions will be 80% faster than ungoverned decisions by 2029. Codewave clients have seen 3X faster data processing and a 40% increase in productivity across reporting and analytics workflows.
KPIs impacted:
- BI ticket backlog volume
- Time-to-insight
- Decision cycle time
- Analyst-to-business-user query ratio
- Reporting time
When this matters most: Organizations scaling analytics across business units, companies with fast-moving operational decisions (logistics, retail, fintech), and any team where the data function is the bottleneck for every KPI conversation.
What Happens When an Enterprise Knowledge Graph Is Missing
Organizations running on siloed databases, flat data models, and disconnected BI layers run into the same set of problems — reliably, and at scale.
Common consequences:
- Debate replaces decisions when Sales and Finance define "churn" differently — meetings stall on metric disputes rather than moving toward action.
- LLM pilots return answers that sound plausible but aren't grounded in verified business data, because there's no structured knowledge layer beneath them.
- Data teams spend 38% of their time on preparation and reconciliation work — capacity that should go toward analysis.
- Every new system, acquisition, or data source requires custom point-to-point connections that break and need ongoing maintenance.
- Gartner estimates poor data quality costs organizations at least $12.9 million per year on average — and that figure doesn't capture the opportunity cost of delayed decisions.
The cost compounds. Every tool or acquisition layered on without a semantic foundation deepens the technical debt. Organizations that delay aren't buying time — they're accumulating a larger unification problem that gets harder to solve with each passing year.
How to Get the Most Value from an Enterprise Knowledge Graph
An enterprise knowledge graph delivers the most value when treated as a strategic data product with clear ownership, defined scope, and measurable business outcomes—not a one-time infrastructure project you deploy and walk away from.
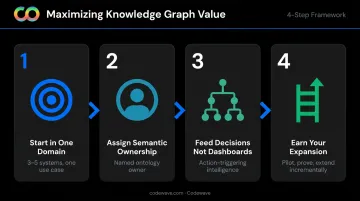
Four conditions consistently separate high-value deployments from stalled ones:
Start in one domain, not everywhere. Pick a high-impact use case—customer 360, fraud detection, or supply chain risk—and connect 3–5 systems. Define what success looks like before you start: cycle time reduction, fewer BI tickets, lower error rates.
Assign semantic ownership. Name an ontology owner responsible for how entities and relationships are defined. Without governance, definitions drift as teams change and the graph loses its value as a shared source of truth.
Feed decisions, not just dashboards. The graph's value compounds when outputs drive actual decisions, AI agent actions, and automated workflows. Reports that get read and set aside don't move the needle—embedded, action-triggering intelligence does.
Earn your expansion. Pilot with one department, prove measurable impact, then extend the ontology and data connections incrementally. The "big ontology upfront" approach delays time-to-value by months and rarely holds up against real business usage.
Codewave's data engineering services cover the integration pipelines, analytics layers, and AI-powered decision infrastructure that make this progression possible—so enterprises can move from fragmented data to a governed knowledge layer without rebuilding core systems from scratch.
Conclusion
An enterprise knowledge graph is the structural layer that makes data trustworthy, AI outputs defensible, and cross-domain decisions possible without routing every question through an engineering queue.
Its advantages compound over time. As more systems connect, more relationships are mapped, and more teams build on a shared, governed understanding of the business, the value of the initial investment multiplies. Organizations that gain the most from knowledge graphs treat them as ongoing practices—with named ownership, regular ontology review, and a commitment to acting on the insights they surface. Those that treat it as a one-time IT project stall after the pilot—and usually can't articulate why.
That stall has a cost: reconciliation overhead, AI outputs no one trusts, and decisions that wait on analysts to manually bridge data systems. The question isn't whether the organization is ready for a knowledge graph. It's how much longer the current state is worth preserving.
Frequently Asked Questions
What is an enterprise knowledge graph?
An enterprise knowledge graph is a structured, relationship-aware data model that maps organizational entities—customers, products, processes, suppliers—and how they connect. It enables machines and humans to query across siloed systems and receive accurate, context-rich answers rather than requiring manual data assembly.
What is the difference between an ERD and a knowledge graph?
An Entity-Relationship Diagram is a static schema used to design relational databases with predefined table structures. A knowledge graph is a dynamic, semantic model that captures relationships in a flexible, machine-traversable format. It supports reasoning, inference, and cross-domain queries that rigid relational schemas cannot handle without custom joins.
How does an enterprise knowledge graph improve AI accuracy?
Knowledge graphs give AI models a deterministic, fact-based foundation by defining exactly what entities are and how they relate. This reduces hallucinations and inconsistent outputs that arise when LLMs generate responses without access to verified, structured business context.
What industries benefit most from enterprise knowledge graphs?
Financial services (fraud detection), healthcare (clinical data integration), insurance (risk modeling), retail (product and customer data at scale), and supply chain-intensive sectors see the highest value. The gains are most pronounced where regulatory requirements, complex entity relationships, or cross-domain data needs converge.
How long does it take to implement an enterprise knowledge graph?
A well-scoped pilot covering one domain and 3–5 systems can reach initial go-live in under three months. Full enterprise-scale expansion depends on ontology complexity, data source diversity, and governance maturity—typically unfolding in phases over 6–18 months.
What is the difference between a knowledge graph and a traditional database?
Traditional databases store data in fixed rows and columns optimized for predefined queries. Knowledge graphs store data as relationships between entities, making it straightforward to traverse complex, multi-hop connections across domains without writing custom joins or rebuilding schemas every time a new question is asked.