Introduction
Sales teams are drowning in data but starving for decisions. The average sales organization runs on eight or more standalone tools, yet according to Salesforce's State of Sales report, sellers still spend 60% of their time on non-selling work. CRM data sits in one place, marketing engagement data in another, and forecast numbers live in a spreadsheet no one fully trusts.
This fragmentation isn't just inefficient—it creates blind spots that cost real revenue. Deals slip through the cracks, territories get designed on gut feel, and forecasts miss quarter after quarter.
Business intelligence for sales connects those silos and turns scattered data into decisions that actually stick. This guide covers what sales BI is, the use cases that move revenue, how to implement it without losing months to the wrong foundation, and where most organizations go wrong.
Key Takeaways
- Sales BI unifies data from CRMs, marketing platforms, and external sources into a single view that guides prospecting, forecasting, and deal management
- Companies embracing data-driven B2B sales report 15–25% EBITDA increases and above-market revenue growth (McKinsey)
- Highest ROI comes from four use cases: lead prioritization, pipeline health monitoring, forecasting, and win/loss analysis
- Successful implementation starts with clean data and clear KPIs—not dashboards
- Dashboard overload, low adoption, and data silos are the three failure modes that sink most BI investments
What Is Business Intelligence for Sales?
Sales BI is the systematic process of collecting, integrating, and analyzing data from multiple sources—CRMs, marketing automation tools, sales engagement platforms, and third-party intent data—to enable smarter decisions across the entire sales funnel.
Two things people commonly confuse it with are worth separating out:
- A CRM stores and manages customer interaction data within a single system. It doesn't tell you which segments convert best across channels.
- Basic analytics tools surface single-source reports. They can tell you how many deals are open in Salesforce—not why certain deal types stall at stage three.
Sales BI synthesizes multiple data streams to answer cross-functional questions: Where is the pipeline leaking? What's the correlation between deal size and sales cycle length? Why do certain outbound segments close at twice the rate of others?
The 5 Core Components
Every sales BI system runs on five connected layers:
- Data Sources — CRM (Salesforce, HubSpot), sales engagement tools, marketing platforms, intent data providers, and firmographic databases
- Data Integration/Pipelines — ETL processes (Fivetran, dbt, Apache Airflow) that extract, clean, and consolidate raw data from each source
- Data Storage — A centralized warehouse (Snowflake, BigQuery, Redshift) that acts as a single source of truth
- Data Analysis/Transformation — Logic applied to calculate derived metrics: stage conversion rates, deal velocity, churn risk scores
- Data Visualization — Dashboards and self-service reports (Power BI, Tableau) that surface insights for reps, managers, and executives
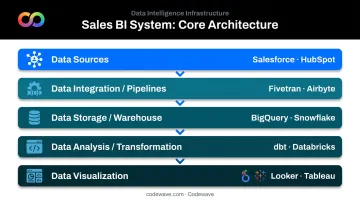
These components are sequential and dependent. Poor data quality at the source corrupts every layer downstream, which is why data governance needs to be built in from day one—not retrofitted after dashboards are already live.
Key Benefits of Sales Business Intelligence
Better Lead Prioritization
SDRs working from a flat lead list waste time on low-fit accounts. Sales BI fixes this by combining firmographic data (company size, industry, tech stack), behavioral signals (website visits, email engagement), and external intent data to rank accounts by actual conversion probability.
The results are measurable. McKinsey research found that companies deploying predictive lead-scoring saw 15–20% improvement in lead conversion rates—a direct consequence of reps focusing their effort on accounts most likely to buy.
More Accurate Forecasting
Xactly's 2024 Sales Forecasting Benchmark Report found that 80% of sales and finance leaders missed at least one quarterly forecast in the prior year, and 98% acknowledged struggling with forecast accuracy. Gut-feel forecasting at the end of Q3 is not a strategy.
BI tracks stage-by-stage conversion rates and applies historical win/loss patterns to project future pipeline outcomes. Sales leaders get early warning of revenue gaps—while there's still time to course-correct, not after the quarter closes.
Real-Time Pipeline Visibility
Live dashboards let managers monitor rep activity, deal velocity, and pipeline health without waiting for a Friday report. A deal that's been sitting in "Proposal Sent" for 30 days gets flagged automatically. Territory imbalances surface before they affect quota attainment.
The shift in coaching is significant: from reviewing last month's losses to intervening on deals at risk right now.
Shorter Sales Cycles Through Intent Signals
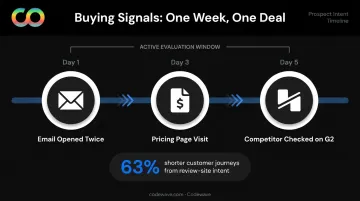
When a prospect opens your email twice, visits your pricing page, and checks a competitor on G2 in the same week, they're evaluating—not just browsing. BI surfaces these signals in real time so reps can time outreach to match actual buying behavior, not a calendar. Dreamdata's analysis of G2 intent data found that customer journeys initiated from a review site were 63% shorter on average than those from other sources.
Reduced Manual Reporting Overhead
Automating data collection and dashboard refresh eliminates hours of weekly CSV exports and copy-paste reporting. In Codewave's analytics implementations, teams have recovered roughly three weeks per month in manual data work, cut reporting time by 40%, and processed data 3X faster—hours that shift from data wrangling to actual analysis.
How to Use Sales BI: Core Use Cases That Drive Revenue
Pipeline Health Monitoring
BI dashboards visualize deal stage distribution, stalled opportunities, and aging pipeline by rep and territory. A manager can see in one view exactly which deals haven't moved in 14 days, which reps are light on Q4 pipeline coverage, and where deal size is shrinking compared to prior quarters.
Lead Scoring and Segmentation
BI models combine ideal customer profile (ICP) fit scores with behavioral signals—website visits, email engagement, funding announcements, hiring spikes—to rank leads by conversion probability. Sales teams work the highest-value accounts first instead of treating every inbound as equal.
Win/Loss Analysis
Patterns hidden inside closed deals contain the clearest signal about what works. BI captures deal characteristics from both won and lost opportunities:
- Deal size and sales cycle length
- Industry and company size
- Competitor involved
- Number of stakeholders engaged
- Stage where deals stalled or accelerated
These findings feed directly into coaching material, updated talk tracks, and ICP refinements.
Revenue Forecasting and Scenario Planning
Where win/loss analysis looks backward, forecasting looks forward — using the same data to shape decisions before they become problems. BI applies weighted pipeline data and historical stage conversion rates to project quarterly revenue. More practically, it lets leadership run scenarios in real time:
- What happens to Q4 revenue if pipeline coverage drops 20%?
- What if the enterprise segment's close rate falls to last year's level?
- Where does the quarter land if two late-stage deals slip?
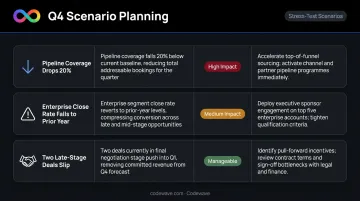
That kind of stress-testing turns the forecast from a static number into an active planning lever.
Territory and Quota Planning
BI analyzes historical win rates by geography, market potential, and rep capacity to design territories and set quotas that are equitable in practice. Poorly designed territories—where one rep has a $2M opportunity-rich patch and another is working a saturated market—cause avoidable burnout and missed quota that had nothing to do with effort.
How to Implement Sales BI in Your Organization
Start with Data Foundations, Not Dashboards
The most common implementation mistake is rushing to build reports before the underlying data is clean and integrated. Gartner research found that 63% of organizations don't have the right data management practices in place—and predict that 60% of AI projects will be abandoned through 2026 because of it.
The same pattern applies to BI. Before building a single dashboard:
- Audit existing data sources — which systems exist, what data each contains, who has access, what's missing
- Define 3–5 core KPIs the system must answer (pipeline coverage, stage conversion, win rate by segment)
- Establish data standards — naming conventions, field definitions, required fields in the CRM
- Build reconciliation logic into the pipeline so data conflicts are resolved automatically, not manually
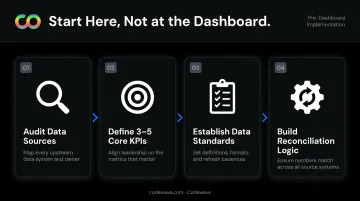
Codewave's implementation approach follows this exact sequence—starting with a structured discovery phase to clarify business goals, define KPIs, and map existing data flows before any visualization work begins. The result is a system that's accurate from day one rather than one that requires constant manual correction.
Build for Adoption, Not Comprehensiveness
A dashboard that shows 40 metrics will be used by no one. Role-specific, lightweight views drive adoption:
- SDRs: Today's priority accounts, outreach volume vs. target, meeting conversion rate
- Account Executives: Pipeline by stage, deal velocity, next steps needed
- Managers: Rep activity summary, pipeline health by territory, forecast vs. target
- Executives: Revenue forecast, win/loss trends, segment performance
The principle is "insight in 3 clicks." If a rep has to navigate three menus to find out which accounts to call today, they'll open a spreadsheet instead. Embedding insights directly into existing workflows—Slack alerts for stalled deals, CRM-native dashboards—removes that friction entirely.
Consider a Specialized Implementation Partner
Building and maintaining data pipelines, transformation logic, and multi-source dashboards in-house requires dedicated engineering resources most sales ops teams don't have. Getting the architecture right from the start—so the adoption work above actually pays off—is where a specialized partner earns its keep.
Codewave builds sales analytics solutions using Snowflake for data warehousing, Apache Kafka for real-time streaming, and Power BI or Tableau for visualization, delivering 95%+ data accuracy across implementations. Basic dashboards go live in six to eight weeks. Comprehensive multi-source implementations typically land in three to six months, depending on data complexity and the number of systems being integrated.
Common Challenges and How to Overcome Them
Sales BI implementations run into the same practical obstacles across most organizations. Three come up repeatedly — and each has a clear fix.
Data Silos and Poor Integration
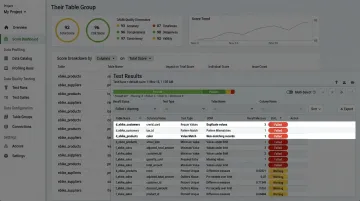
CRMs, engagement tools, and marketing platforms rarely sync cleanly. Inconsistent naming conventions, duplicate records, and missing fields degrade BI outputs and erode trust in the numbers.
The fix is enforcing data standards at the input level and building reconciliation logic into the pipeline. Codewave uses tools like Great Expectations, dbt, and Dedupely to handle deduplication, field standardization, and validation before data reaches any dashboard.
Low Adoption
Complex interfaces and irrelevant metrics cause reps to revert to spreadsheets within weeks. Even well-designed systems fail when the people meant to use them don't.
Effective adoption requires:
- Co-designing dashboards with the people who will use them
- Keeping views focused on decisions each role actually makes
- Reinforcing usage through weekly coaching, not optional training
Difficulty Translating Insights into Action
Many teams can generate reports but can't change behavior based on them. The fix is operationalizing insights directly into playbooks.
If win/loss analysis shows deals involving legal teams take 40% longer, update the process. If intent data shows Friday outreach underperforms, change the cadence. BI findings should drive how the team sells, not just how it reports.
Frequently Asked Questions
What are the 5 components of business intelligence?
The five components are: data sources (CRM, marketing tools, intent platforms), data integration pipelines (ETL), centralized data storage, data analysis and transformation, and visualization via dashboards and reports. They function as a connected system — quality problems in any earlier layer degrade everything downstream.
What is the role of sales intelligence?
Sales intelligence focuses on gathering and analyzing data about prospects, accounts, and competitors to sharpen targeting and personalize outreach. It's narrower than sales BI: focused on the external buying environment rather than internal pipeline and performance data.
How is sales BI different from a CRM?
A CRM stores and manages customer interactions within one system. Sales BI aggregates data across multiple systems—CRM, marketing, intent tools, finance—to answer cross-functional questions a single CRM can't answer, like which segments have the highest lifetime value or where pipeline consistently stalls.
What metrics should a sales BI dashboard track?
Core metrics include pipeline coverage, deal velocity, stage conversion rates, win/loss ratio, average deal size, and forecast accuracy. SDR dashboards typically add activity-to-meeting conversion. Executive dashboards emphasize revenue forecast vs. target and segment performance trends.
How long does it take to implement business intelligence for sales?
Basic dashboards replicating existing reports go live in four to eight weeks. Full implementations covering multiple data sources, custom transformations, and self-service analytics take two to six months. The primary timeline drivers are data source count, existing data quality, and internal stakeholder availability.
What ROI can sales teams expect from BI?
ROI comes through three channels: time saved on manual reporting, better resource allocation from accurate forecasting, and faster intervention on underperforming pipeline. A Forrester TEI study of Clari's platform found 398% ROI with payback in under six months and a 33% reduction in forecasting activities.