That gap — between data generated and data acted on — is where margin gets lost. Rising raw material costs, supply chain instability, and tighter production windows have made gut-feel decisions increasingly expensive. Spreadsheets and siloed systems can't keep pace with the speed or complexity modern manufacturing demands.
This article covers what business intelligence actually does inside manufacturing operations, the specific advantages it delivers across supply chain, production, and quality functions, and what manufacturers risk by continuing without it.
Key Takeaways
- BI for manufacturing turns raw operational data into decisions across production, supply chain, quality, and finance
- Most manufacturers still manage data manually; BI closes the gap between data collected and data used
- The three highest-impact advantages are supply chain visibility, production efficiency, and predictive quality and maintenance
- Manufacturers without BI operate reactively — costs accumulate before problems are even visible
- BI delivers compounding returns when applied consistently, not just deployed and forgotten
What Is Business Intelligence in Manufacturing?
Business intelligence in manufacturing is the process of pulling raw data from across operations — ERP systems, production lines, equipment sensors, supplier portals, warehouse platforms — and converting it into clear signals that guide faster, more precise decisions.
It's not a single tool. BI is a practice that spans:
- Production scheduling — aligning output targets with actual capacity and workforce availability
- Inventory management — tracking stock levels at the SKU level across locations in real time
- Supplier performance — monitoring on-time delivery rates, lead time variance, and defect rates by vendor
- Equipment maintenance — identifying failure patterns before breakdowns occur
- Quality control — detecting defect-prone process steps before product reaches inspection or the customer
- Financial planning — connecting production cost data to margin analysis and budget forecasts
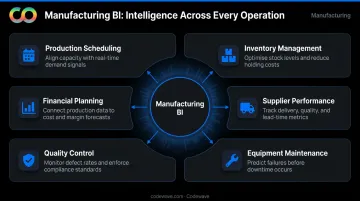
The goal is decision-making grounded in what's actually happening on the floor — not what a weekly report summarized three days after the fact. Dashboards are just the surface; the real value is in the speed and accuracy of the calls those dashboards enable.
Key Advantages of Business Intelligence for Manufacturing
The advantages below describe changes in how manufacturing operations run day to day. Each connects directly to metrics manufacturers already track: cost per unit, uptime, defect rates, inventory turns, and margin.
End-to-End Supply Chain and Inventory Visibility
BI gives manufacturers a unified, real-time view of the entire supply chain — from raw material procurement through production to last-mile delivery — alongside current inventory levels at the SKU level.
It creates this visibility by aggregating data from ERP systems, supplier portals, warehouse management tools, and logistics platforms into a single analytics layer. That consolidation cuts out the manual data-gathering that delays decisions by hours or days.
Why this matters financially: Excess inventory carries a real cost. Standard inventory carrying costs run 15% to 25% of inventory value on hand, meaning $1M in excess stock costs $150K–$250K annually just to hold. On the other side, stockouts halt production — and when a line goes down, the clock starts immediately. Digital supply chain analytics can reduce forecast errors by 30% to 50% and automate 80% to 90% of manual planning tasks, according to McKinsey's Supply Chain 4.0 analysis.
When a supplier falls behind schedule or demand spikes unexpectedly, BI surfaces the signal early enough to act — rerouting orders, adjusting production sequencing, or negotiating alternative sourcing before the disruption reaches the floor.
KPIs directly impacted:
- Inventory turnover rate
- Supplier on-time delivery rate
- Days of supply
- Stockout frequency
- Order fill rate
- Carrying cost of inventory
Where this advantage is highest: Manufacturers managing multiple suppliers, SKUs across several locations, or seasonal demand swings — particularly in automotive, aerospace, and industrial components, where supply chain delays translate directly into halted production.
Production Performance and Operational Efficiency
BI enables manufacturers to monitor production output, machine utilization, workforce efficiency, and throughput in real time — against planned targets.
By collecting data from SCADA systems, MES platforms, and work order logs, BI produces a live picture of Overall Equipment Effectiveness (OEE), capacity bottlenecks, and resource allocation gaps. Manual reporting would surface the same information days or weeks too late to act on.
The OEE gap is large. World-class OEE for discrete manufacturers is 85%; the industry average sits around 60%. That 25-point gap represents production capacity sitting unused — already paid for in labor, equipment, and overhead. BI makes that hidden cost visible and measurable.
McKinsey's 2022 Industry 4.0 analysis found that manufacturers applying data analytics and AI to production operations achieved:
- 30–50% reductions in machine downtime
- 10–30% increases in throughput
- 15–30% improvements in labor productivity
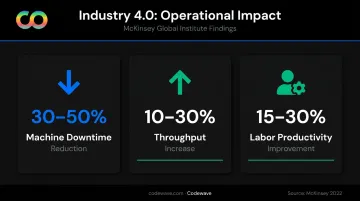
When a machine's output rate drops or a bottleneck forms at one workstation, BI flags it before the slowdown cascades across the line. That early visibility turns reactive decisions into planned responses — which is where the gains above actually come from.
KPIs directly impacted:
- OEE
- Production cycle time
- Throughput rate
- Labor utilization per work order
- Scrap rate
- Work-in-progress (WIP) volume
- On-time production completion rate
Where this advantage is highest: High-volume or high-mix production environments, multi-shift operations, facilities running older equipment with inconsistent output, or manufacturers scaling capacity across departments.
Predictive Quality Control and Maintenance Intelligence
BI enables manufacturers to move from inspecting quality after the fact to predicting and preventing defects during production. On the maintenance side, the shift is equally direct: from repairing equipment after breakdowns to forecasting failures before they occur.
By analyzing patterns in production data, defect logs, sensor outputs, and historical equipment performance, BI identifies which process steps, operating conditions, or assets are most associated with quality deviations and mechanical failures.
The cost of getting this wrong is steep. Siemens' 2024 True Cost of Downtime report found that unplanned downtime costs the world's 500 largest companies $1.4 trillion annually, with automotive manufacturers losing $2.3 million per hour of unplanned downtime. Deloitte's predictive maintenance analysis found that poor maintenance strategies reduce plant capacity by 5% to 20%, and that unplanned downtime costs manufacturers an estimated $50 billion annually.
Deloitte's research shows predictive maintenance can:
- Reduce breakdowns by 70%
- Lower maintenance costs by 25%
- Increase equipment uptime by 10–20%
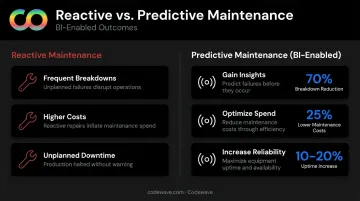
Predictive quality control reduces product recalls, customer complaints, and compliance violations. Identifying a defect-prone condition at the machine level costs far less than catching it at final inspection — and far less still than a customer return or recall.
KPIs directly impacted:
- Defect rate
- First-pass yield (FPY)
- Return and recall rate
- Mean time between failures (MTBF)
- Mean time to repair (MTTR)
- Planned vs. unplanned maintenance ratio
- Warranty claim volume
Where this advantage is highest: Regulated industries — medical devices, food and beverage, aerospace — where compliance is non-negotiable; manufacturers with aging equipment fleets; high-volume lines where a single defect point propagates quickly.
What Happens When BI Is Missing
Operating without BI creates compounding operational costs — and they show up across every function simultaneously.
Without BI, manufacturing operations typically look like this:
- Decisions run on stale data — weekly reports are outdated on arrival, and by the time an issue is surfaced through a spreadsheet, the cost has already been incurred
- Inventory is managed reactively — too much stock ties up working capital; too little stops production
- Equipment failures are surprises — maintenance is scheduled by calendar, not condition, so breakdowns happen mid-shift or mid-run
- Quality problems are caught downstream — or by customers — rather than at the process step where they originated
- Reporting consumes hours that should go toward operational decisions, producing outputs nobody acts on fast enough
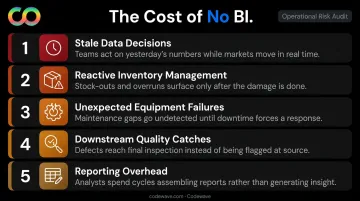
The competitive stakes are just as real. Manufacturers still relying on manual data collection lose ground on margin, scalability, and decision speed as peers move to data-driven operations. LNS Research's 2023 data found that industrial operations leaders outperform followers by 55% in operational KPIs — a gap that widens the longer the delay.
How to Get the Most Value from BI in Manufacturing
BI delivers compounding returns when applied consistently across functions. The goal is integrated data, not more dashboards.
Manufacturing BI performs best when these conditions are in place:
- Data sources are connected — ERP, MES, SCADA, CRM, and logistics platforms feed into a central analytics layer rather than remaining separate silos
- KPIs are reviewed on a defined cadence — daily for production and quality, weekly for supply chain, monthly for financial performance
- Insights are acted on at the process level — floor-level teams need access to the data that drives their decisions, not just executive summaries
- Implementation is phased — starting with the highest-impact use case before expanding into predictive analytics
Getting those conditions right is an implementation problem as much as a technology problem. Codewave's work with manufacturers typically starts with a centralized quality management system that integrates with existing ERP data, enables real-time floor-level reporting from mobile devices, and delivers executive dashboards showing quality trends across facilities. Live dashboards before predictive models — this approach delivers measurable results before the broader data architecture is fully built out.
For manufacturers evaluating BI partners, hold vendors to outcome commitments, not feature lists. Codewave's ImpactIndex™ model, for example, ties engagements to measurable results: 60% better data accessibility and 3X faster data processing are the benchmarks, not the pitch.
Conclusion
BI for manufacturing is about control — specifically, control over the variables that determine cost, quality, and output before they become problems.
The three advantages covered here — supply chain visibility, operational efficiency, and predictive quality and maintenance intelligence — compound over time. Each month of consistent BI application widens the gap between manufacturers who act on data and those who react to consequences.
Treat BI as an ongoing operational practice, not a one-time deployment. Manufacturers who commit to that practice convert data into a structural edge: lower costs, fewer surprises, and faster decisions that competitors running on intuition simply can't match.
Frequently Asked Questions
How can I use AI in my manufacturing business?
AI in manufacturing is most commonly applied through BI platforms — using machine learning to predict equipment failures, forecast demand, detect quality anomalies, and automate reporting. This shifts analytics from descriptive (what happened) to predictive (what will happen) and prescriptive (what to do next).
What is MI in manufacturing?
Manufacturing Intelligence (MI) focuses on shop-floor data — machine output, OEE, process parameters — to optimize production operations. Unlike broader BI, MI is scoped to operational data rather than spanning finance, supply chain, and customer data.
What are the 5 components of business intelligence?
The five core components are:
- Data sourcing and integration — connecting disparate systems into a unified feed
- Data storage — warehouses or data marts that hold structured, query-ready data
- Data analysis — descriptive, diagnostic, and predictive methods
- Visualization and reporting — dashboards, KPI scorecards, and alerts
- Data governance — quality controls, security policies, and access management
What is the difference between BI and ERP in manufacturing?
ERP systems capture and manage operational transactions — orders, inventory, production records. BI systems analyze that data to surface patterns, trends, and performance insights. The two work best together: ERP feeds the data, BI makes it actionable.
What KPIs should manufacturers track with BI?
The most critical manufacturing KPIs include OEE, production cycle time, defect rate and first-pass yield, inventory turnover, on-time delivery rate, cost of goods sold (COGS), supplier on-time performance, and unplanned downtime frequency.
How long does it take to implement BI in a manufacturing company?
Basic dashboards and reporting can be live in weeks; full predictive analytics across supply chain, production, and quality typically takes several months. Phased implementation — starting with the highest-impact use case — delivers early wins while the broader solution is built out.