Introduction
Most retailers today have more data than they know what to do with. Transaction logs, loyalty programs, inventory systems, and supplier feeds all generate enormous volumes. Yet according to a Forrester retail analytics survey summarized by WNS, 60% of retailers cite lack of maturity in data-management technology as a top challenge, and 44% remain at only an intermediate analytics maturity level.
That gap between collecting data and acting on it is where growth opportunities are lost.
This guide breaks down what advanced retail analytics actually means, how it differs from basic reporting, the four types of analysis every retailer should understand, the highest-value use cases, KPIs worth tracking, and how to build a stack that moves the needle.
Key Takeaways:
- Advanced analytics replaces historical reports with AI-driven forecasting and automated recommendations
- Demand forecasting, dynamic pricing, and customer segmentation deliver the highest measurable ROI
- Most retailers are stuck at descriptive maturity — the jump to predictive/prescriptive is where real value is
- GMROI, CLV, and inventory turnover are where analytics impact shows up most clearly
- Data silos, poor governance, and organizational resistance are the top three implementation barriers
What Is Advanced Retail Analytics?
Retail analytics is the process of collecting, integrating, and analyzing data from across the retail business — sales, inventory, pricing, customer behavior, supply chain — to make better decisions faster. The "advanced" part is what separates it from a monthly sales report in Excel.
Basic vs. Advanced: A Concrete Distinction
| Dimension | Basic Analytics | Advanced Analytics |
|---|---|---|
| Question answered | What happened? | Why? What's next? What should we do? |
| Primary tool | Spreadsheets, BI dashboards | AI/ML models, real-time data feeds |
| Output | Historical report | Forecast, recommendation, automated action |
| Example | Last quarter's sales by category | Demand forecast adjusting for seasonality, competitor pricing, and upcoming promotions |
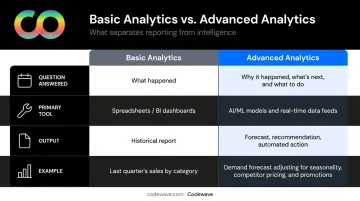
Basic analytics tells you what already happened. Advanced analytics tells you what's coming — and what to do about it.
Why This Shift Matters Now
Data-native competitors aren't waiting. The retail analytics market is projected to grow from $8.5 billion in 2024 to $25.0 billion by 2029, and 69% of retailers reported annual revenue increases attributed to AI adoption, according to an NVIDIA survey of retail and CPG companies.
Retailers who delay building predictive capabilities aren't just missing growth opportunities. They're actively ceding ground to competitors who already have these systems in place.
The Four Types of Retail Analytics Explained
Understanding the analytics maturity ladder is the starting point for any serious retail analytics program. Each tier answers a different question and requires progressively more sophisticated infrastructure.
Descriptive Analytics — What Happened
Descriptive analytics organizes historical data into summaries: sales reports, inventory snapshots, KPI dashboards. It's the foundation of any analytics program, typically handled through BI tools like Power BI or Tableau.
The limitation is the rearview mirror problem. Knowing that a product underperformed last month doesn't tell you why — or what to do differently next cycle.
Diagnostic Analytics — Why It Happened
Diagnostic analytics uses statistical techniques and machine learning to surface correlations and root causes. Why did that product underperform in the Northeast during the spring promotion? Was it pricing, a competitor's move, poor shelf placement, or a regional demand shift?
This is where analytics becomes investigative — and where most retailers start acting on insights rather than just reporting them.
Predictive Analytics — What Will Happen
Predictive analytics uses historical data, AI models, and external signals — seasonality, competitor pricing, consumer trends, weather — to forecast demand, customer behavior, and market shifts.
The distinction between demand forecasting and simple sales forecasting matters here. Sales forecasting typically extrapolates from prior periods. Demand forecasting accounts for a much wider range of variables simultaneously, producing forecasts that reflect real market conditions rather than historical momentum.
McKinsey research on AI-driven operations forecasting found that AI can reduce supply-chain errors by 20% to 50% and cut lost sales from out-of-stocks by up to 65% — a gap that descriptive-only programs simply cannot close.
Prescriptive Analytics — What to Do About It
Prescriptive analytics is the highest tier. It goes beyond prediction to recommend specific actions:
- Optimal inventory allocation for a specific SKU across 200 locations
- Precise price adjustments for products with slowing velocity
- Promotion timing calibrated to maximize incremental lift
Reaching this tier requires AI, simulation modeling, and intelligent automation. It's also where the largest margin improvements occur — because recommendations are optimized for outcomes, not just data accuracy.
Key Use Cases of Advanced Retail Analytics
Demand Forecasting and Inventory Optimization
Global inventory distortion cost retailers an estimated $1.77 trillion in 2023, with out-of-stocks alone accounting for $1.2 trillion, according to an IHL study hosted by Sensormatic. These aren't rounding errors — they're the direct financial consequence of demand forecasting failures.
Predictive analytics calculates demand for each SKU, at each location, across time intervals — factoring in seasonality, promotions, supply chain variability, and historical stockout patterns. When combined with IoT-enabled inventory visibility and real-time data feeds, the result is automated replenishment that eliminates both overstock carrying costs and lost sales from empty shelves.
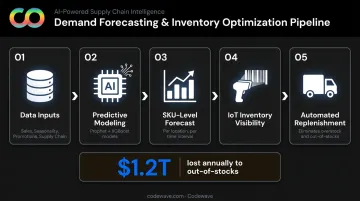
Codewave's retail analytics work includes demand forecasting models built with Prophet for time series analysis and XGBoost for structured retail data, with Monte Carlo simulations used for scenario-based planning during seasonal peaks — insights surfaced through Power BI and Tableau dashboards for store and supply chain teams.
Customer Segmentation and Personalization
71% of consumers expect personalized interactions. 76% get frustrated when they don't receive them. That's not a preference — it's an expectation that directly affects purchase decisions and brand loyalty.
Advanced segmentation moves beyond broad demographics into behavioral micro-segments using RFM analysis (Recency, Frequency, Monetary value) and ML-based clustering. The output: hyper-targeted product recommendations, loyalty offers, and promotions calibrated to what specific customer segments actually respond to.
McKinsey research consistently finds personalization drives 10% to 15% revenue lift, with some retailers achieving up to 25% depending on implementation depth.
Dynamic Pricing and Promotion Optimization
AI-driven pricing models analyze competitor pricing, real-time demand signals, customer purchase history, and external factors like local events to adjust prices dynamically. McKinsey estimates dynamic pricing can lift sales 2% to 5% and improve margins 5% to 10% — meaningful numbers at retail scale.
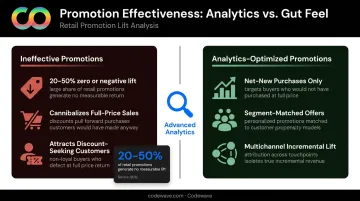
Promotion optimization addresses a related problem: BCG research found that 20% to 50% of retail promotions generate no noticeable sales lift or actually have negative impact. Advanced analytics separates genuine incremental lift from purchases that would have happened anyway. Merchandising teams gain clarity on:
- Which promotions drive net-new purchases vs. cannibalizing full-price sales
- Which customer segments respond to discounts vs. value-added offers
- Where promotional spend drives real incremental lift across channels
Omnichannel Customer Journey Analytics
Omnichannel analytics unifies data from in-store, mobile, web, and loyalty programs into a single customer view. A Harvard Business Review study of 46,000 shoppers found that omnichannel customers spent 4% more in-store and 10% more online than single-channel shoppers, and made 23% more repeat visits over six months.
Understanding cross-channel behavior — where customers enter the funnel, where they drop off, and what brings them back — is foundational to a unified commerce strategy. Without this visibility, personalization efforts are built on partial signals, leading to missed moments and misallocated budget.
Fraud Detection and Supply Chain Risk Management
Average retail shrink reached 1.6% of sales in FY2022, totaling $112.1 billion in losses according to the NRF National Retail Security Survey. ML-based anomaly detection can identify fraudulent transaction patterns in near real-time, flagging suspicious activity before chargebacks accumulate.
The same risk-scoring logic extends beyond fraud. Supply chain analytics monitors supplier reliability, flags potential disruption signals early, and helps procurement teams act before shortfalls translate into stockouts or emergency sourcing costs.
Critical KPIs to Measure Retail Analytics Success
Measuring the wrong things creates false confidence. These five KPIs reflect where advanced analytics has the most direct operational and financial impact.
| KPI | What It Measures | Analytics Connection |
|---|---|---|
| Conversion Rate | % of visitors who purchase | Merchandising, pricing, and recommendation effectiveness |
| Customer Lifetime Value (CLV) | Total projected revenue per customer relationship | Segmentation quality and retention program ROI |
| Inventory Turnover | How quickly inventory sells and is replaced | Demand forecasting accuracy and assortment health |
| Sell-Through Rate | % of inventory sold in a period | Markdown exposure and buying decision quality |
| GMROI | Gross margin generated per dollar of inventory invested | North-star profitability KPI across assortment, allocation, and pricing |
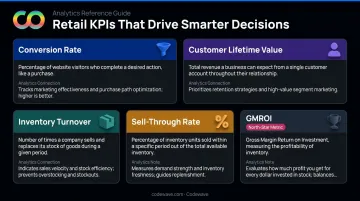
GMROI is the metric where prescriptive analytics produces the clearest signal. It ties inventory investment directly to margin generated. When analytics optimizes simultaneously across assortment depth, location-level allocation, and pricing decisions, GMROI is where those gains register first.
Predictive models give CLV a forward-looking edge by flagging early churn signals — declining purchase frequency, shrinking basket sizes — so retention teams can act before the relationship is lost.
Overcoming Common Challenges in Retail Analytics
Data Silos and Integration Complexity
Most retailers store data in disconnected systems: POS, ERP, CRM, e-commerce platforms, loyalty programs. Unified analysis requires both technical integration and organizational alignment — two things that rarely advance at the same pace.
The technical side involves ETL pipelines, cloud data warehousing, and event streaming infrastructure. Codewave's approach builds toward a single, real-time source of truth using:
- Apache Kafka and Amazon Kinesis for real-time data collection
- dbt for transformation and validation
- Apache Airflow for pipeline scheduling
- AWS, Azure, or Google Cloud for centralized storage
The organizational side is harder. Finance, operations, merchandising, and digital teams often protect their data as a form of operational control. Breaking that down requires executive mandate, not just technical plumbing.
Organizational Resistance and Change Management
Demand planners and store operations staff who have built workflows around manual processes don't naturally embrace algorithm-driven recommendations — especially when those recommendations contradict their experience.
Effective adoption requires:
- Running pilot programs that show measurable accuracy gains against existing processes
- Involving business users in feature selection and model validation, not just reviewing outputs
- Communicating clearly about what the model accounts for and where its limits are
- Building training around real workflows, not generic software walkthroughs
Codewave addresses this through Strategic Design Thinking Workshops focused on digital transformation and change management — a recognition that the human side of analytics adoption matters as much as the technical build.
Data Quality and Governance
Analytics outputs are only as reliable as the data inputs. Duplicate records, missing fields, and inconsistent product labeling across systems compound downstream, inflating forecast errors and undermining confidence in recommendations.
Privacy compliance adds another layer. Collecting and activating customer data must comply with applicable regulations, and retailers need governance frameworks — data ownership policies, access controls, audit trails — in place before scaling advanced analytics programs. Only 12% of data analytics professionals said in a 2024 survey that their organization's data was ready for AI, according to BRG's retail AI report.
Building Your Retail Analytics Stack
Core Technology Components
A modern retail analytics stack typically includes four layers:
- Data ingestion — Apache Kafka or Amazon Kinesis for event streaming; Fivetran for connector-based extraction
- Storage and processing — Cloud data warehouses (Snowflake, BigQuery, or Redshift depending on existing cloud infrastructure)
- Modeling and AI — XGBoost and Prophet for forecasting; Keras for ML-based segmentation; Monte Carlo simulations for scenario planning
- Visualization and reporting — Power BI or Tableau dashboards surfacing insights to planning, merchandising, and operations teams
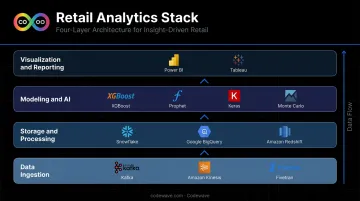
The right combination depends on data volume, use case complexity, and internal capability. A retailer running 50 SKUs across three locations has different infrastructure needs than one managing 500,000 SKUs across a distributed omnichannel network.
The Build vs. Buy Decision
Purpose-built retail analytics platforms offer pre-configured models and faster time to value — particularly useful for retailers with limited data science capacity who need proven demand forecasting or markdown optimization without extensive configuration.
Custom solutions built with a specialized analytics partner allow greater flexibility for unique assortment structures, proprietary data sources, or optimization objectives that off-the-shelf platforms don't support natively.
The decision typically hinges on three factors:
- Data maturity — Can your current data infrastructure support custom model training?
- Internal resources — Do you have data engineers and scientists to maintain a custom build?
- Optimization granularity — Do your use cases require retailer-specific logic that platforms can't accommodate?
Codewave's Approach to Retail Analytics
Codewave has worked with 400+ businesses across 15+ industries, bringing together AI/ML development, data engineering, and phased delivery to retail analytics engagements. Stack decisions follow client requirements, not vendor preferences.
For retail clients, this includes:
- Demand forecasting models using Prophet and XGBoost
- Customer segmentation through Keras-powered ML
- Real-time inventory dashboards via Power BI and Tableau
- ETL pipelines integrating POS, e-commerce, and loyalty data into a centralized analytics layer
Each engagement starts with a discovery phase that defines success metrics before development begins — covering data readiness, integration feasibility, and KPI targets. Phased delivery then lets model performance be validated against real business outcomes before full-scale rollout.
Frequently Asked Questions
What are the 5 KPIs in retail?
The five KPIs most directly impacted by advanced analytics are:
- Conversion rate — percentage of visitors who purchase
- Customer Lifetime Value (CLV) — total projected revenue per customer
- Inventory turnover — how quickly stock sells and is replenished
- Sell-through rate — percentage of inventory sold in a given period
- GMROI — gross margin generated per dollar of inventory invested
How is data analytics used in retail?
Retail analytics is applied across demand forecasting, customer segmentation, dynamic pricing, promotion optimization, loyalty program management, inventory management, fraud detection, and supply chain risk scoring — accelerating decisions that directly affect margin and efficiency.
What are the four types of advanced analytics?
The four types are:
- Descriptive — what happened
- Diagnostic — why it happened
- Predictive — what will happen
- Prescriptive — what action to take
Most retailers operate primarily at the descriptive level. Prescriptive analytics is where the largest margin and efficiency gains occur.
What is the difference between basic and advanced retail analytics?
Basic analytics relies on historical reporting and spreadsheet-level analysis. Advanced analytics uses AI, machine learning, and real-time data to forecast future outcomes, identify root causes, and automate recommendations — moving from rear-view insight to forward-looking decision support.
What are the biggest challenges in implementing retail analytics?
The most common barriers include:
- Data silos across disconnected POS, ERP, CRM, and e-commerce systems
- Poor data quality that undermines model accuracy
- Organizational resistance from teams accustomed to manual processes
- Integration complexity when unifying disparate data sources into a single analytics layer
How does AI improve retail analytics?
AI enables analytics to process far larger datasets at higher speed, detecting non-obvious patterns across millions of transactions. It generates real-time recommendations at the SKU and customer level, and continuously improves model accuracy through machine learning feedback loops. Rule-based or spreadsheet approaches cannot replicate any of these capabilities.